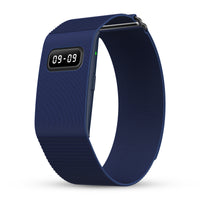

Accurate health data is the foundation of a good wellness strategy. To provide transparency on how the Pebble Qore View performs, we are launching a two-part comparison series. In this first installment, we focus on two core pillars: Activity and Recovery.
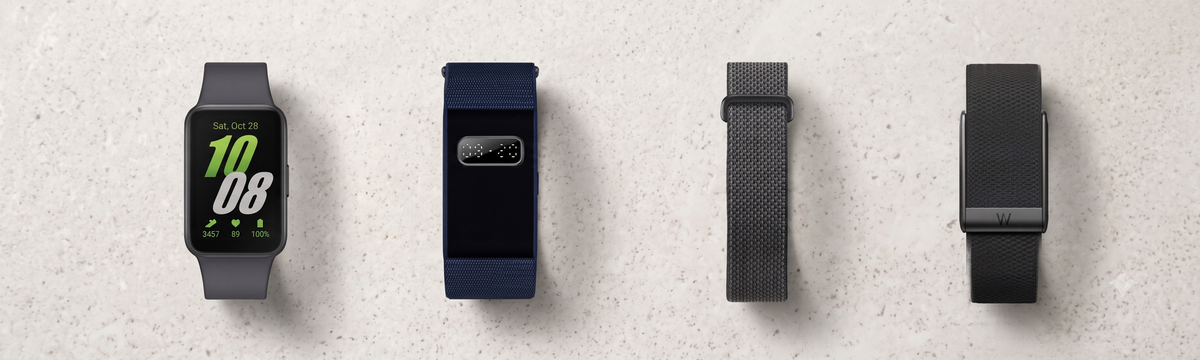
We tested the Pebble Qore View against three established competitors: the Whoop 5, Google Fitbit Air, and Galaxy Fit. We wore these devices simultaneously during a controlled outdoor walk and an overnight sleep cycle to compare sensor performance and algorithm maturity.
Chapter 1: The Activity Test
Tracking activity involves more than just counting steps; it’s about understanding your total physical output. In our outdoor walk test, we tracked five key metrics: Steps, Average Heart Rate, Calories, Pace, and Distance.
It is normal for wearable devices to show minor discrepancies. These variations often stem from differences in sensor positioning, accelerometer sensitivity, and how each device filters "noise" (like casual hand movements) from actual exercise.
Activity Data Comparison

|
Device |
Steps |
HR Avg |
Cal |
Pace |
Dist (km) |
|---|---|---|---|---|---|
|
Fitbit Air |
1446 |
102 |
161 |
28:24/km |
1.09 |
|
Galaxy Fit |
1259 |
103 |
94 |
30:43/km |
0.98 |
|
Qore View |
1194 |
102 |
98 |
27:26/km |
1.11 |
|
Whoop |
1159 |
100 |
67 |
25:16/km |
1.2 |
As shown in the data, the Qore View aligns closely with high-grade benchmarks like the Whoop 5 and Galaxy Fit. While the Fitbit Air recorded a higher step count, this is often due to a broader sensitivity threshold that includes incidental movement. The Qore View’s dynamic filtering is tuned to isolate sustained, rhythmic activity, providing a more precise reading of your actual exertion.
Chapter 2: The Science of Recovery
Sleep is when your body repairs itself. To understand sleep quality, we track four distinct stages:
-
Awake: Moments of light arousal during the night.
-
REM: Important for cognitive rest and memory.
-
Light: The baseline transition phase.
-
Deep: Crucial for physical tissue repair.
Sleep Stages Comparison

|
Device |
Total Sleep |
Awake |
REM |
Light |
Deep |
|---|---|---|---|---|---|
|
Fitbit Air |
6:56 |
0:15 |
2:12 |
3:21 |
1:23 |
|
Galaxy Fit |
7:15 |
0:00 |
1:12 |
4:40 |
1:23 |
|
Qore View |
7:17 |
0:04 |
2:13 |
3:43 |
1:21 |
|
Whoop |
7:11 |
0:06 |
1:55 |
3:05 |
2:05 |
The Qore View performs consistently, providing sleep cycle segmentation that compares favorably with industry leaders. While slight differences are inevitable—each device uses proprietary thresholding to classify these stages—our data confirms the Qore View provides a reliable, detailed look at your nightly restoration.
Conclusion
The results from this first series indicate that the Pebble Qore View is a reliable, high-performing tracker that holds its own against established market standards. Whether you are monitoring physical exertion or analyzing your sleep architecture, our technology provides the accurate insights you need. Stay tuned for Part II, where we will explore stress management and autonomic nervous system metrics.